Weekly Place Analytics
Weekly Place Analytics provide a comprehensive weekly summary of facility usage, including key metrics and trends to track changes over time.
- Sign in to Kisi
- In the left sidebar, click Insights
- Select Weekly Place Analytics
- Choose the place for which you want to generate the report
- To change the analyzed time period, click on Change. The analyzed period can be any time in the past, but is limited to seven days from the selected starting date.
In addition to viewing the report in the web dashboard, you can also export it as a PDF or schedule it to be automatically sent via email at your preferred frequency.
Daily place usage
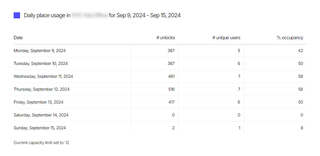
The occupancy rate is calculated based on the set capacity limit for the place. In this example, with a capacity limit set to 12 users, an occupancy of 6 unique users results in a rate of 50%.
Heatmap of unique user unlocks
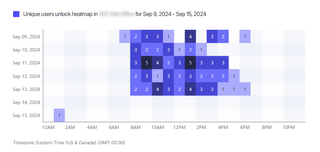
The heatmap illustrates the number of unique unlocks for each day of the week and each hour of the day, with colors intensifying to indicate higher unlock counts.
Weekly unique users
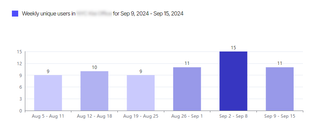
The first five bars represent the number of weekly unique users over the previous five weeks, while the last bar displays the number of weekly unique users for the currently selected period.
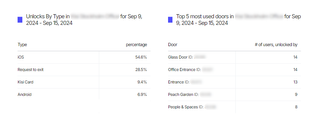
Unlocks by credential type, top 5 most frequently used doors
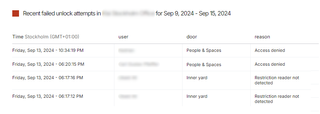
Recent failed unlock attempts
Top 5 held open and forced open doors
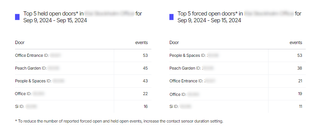
Learn more about held open and forced open events here.
Controllers with the lowest average and highest WAN uptime
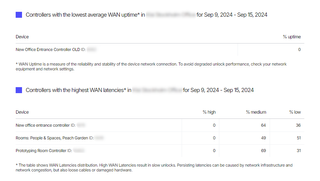
Learn more about controller WAN latencies here.
Readers with the lowest average and highest WAN uptime
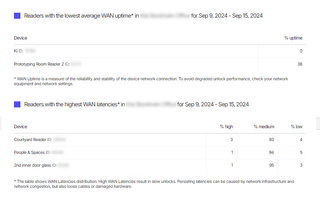
Learn more about reader WAN latencies here.
Devices with limited offline support
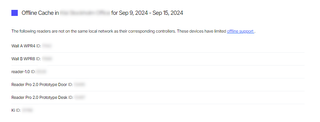
Learn more about Offline Cache here.