Unlock statistics and trends
With Unlock Statistics and Trends, you can analyze unique user unlocks, total unlocks, and failed unlocks over a 35-day period, comparing these metrics to the 6-month weekday average. The interactive report enables users to toggle data visibility by clicking on the legend. Additionally, the report can be downloaded or subscribed to, with subscription management accessible on the Reports page.
- Sign in to Kisi
- In the left sidebar, click Insights
- Select Unlock Statistics and Trends
- Choose the place for which you want to generate the report
- To change the analyzed time period, click on Change. The analyzed period can be any time in the past, but is limited to 35 days from the selected starting date.
In addition to viewing the report in the web dashboard, you can also export it as a PDF or schedule it to be automatically sent via email at your preferred frequency.
Daily unique users
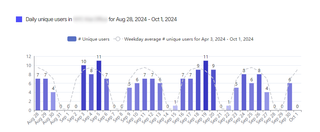
- The bar chart shows the number of daily unique users from August 28 to October 1, 2024. The bar color intensifies with higher user counts and fades with lower numbers, with peaks on September 5 and 19 (both 11 users).
- The dashed line indicates the weekday average of unique users from April 3 to October 1, 2024, providing a 6-month comparison trend.
Daily successful unlocks
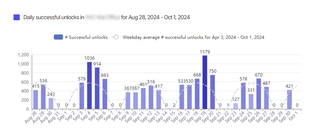
- The bar chart shows the number of daily successful unlocks from August 28 to October 1, 2024. The bar color intensifies with higher unlock counts and fades with lower numbers. Peaks occur on September 4 (1,036 unlocks) and September 20 (1,179 unlocks).
- The dashed line represents the weekday average of successful unlocks from April 3 to October 1, 2024, helping to compare daily performance against a 6-month trend.
Daily failed unlocks
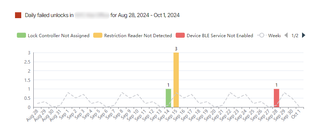
- The bar chart shows daily failed unlocks from August 28 to October 1, 2024, with different colors representing specific failure reasons:
- Green for Lock Controller Not Assigned
- Yellow for Restriction Reader Not Detected
- Red for Device BLE Service Not Enabled
- The dashed line indicates the weekday average of failed unlocks from April 3 to October 1, 2024, providing a 6-month comparison trend.