Network visualization
Gain comprehensive insight into your Kisi hardware infrastructure with Network Visualization, helping you identify device dependencies with ease, monitor device connectivity, and detect network issues. This tool offers a clear, visual representation of how your Kisi devices are interconnected across Locks, Elevators, or Zones, enabling proactive troubleshooting and maintenance.
- Sign in to Kisi
- In the left sidebar, click Insights
- Select Network Visualization
- Choose the place for which you want to generate the network visualization graph
In addition to viewing the graph in the web dashboard, you can also export it as a PDF or schedule it to be automatically sent via email at your preferred frequency.
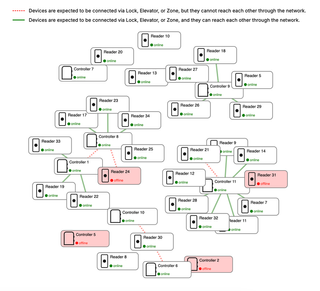
- The red dashed line indicates devices that are expected to be connected through a Lock, Elevator, or Zone but are currently unable to communicate over the network. This suggests a potential connection issue that may require attention.
- The green line represents devices that are expected to be connected via a Lock, Elevator, or Zone and are successfully communicating over the network, confirming a healthy connection.
- Unconnected devices: Devices that do not have any connections to others are not expected to be linked via Lock, Elevator, or Zone. These may function independently or in a different capacity and do not require network communication with other devices in this visualization.